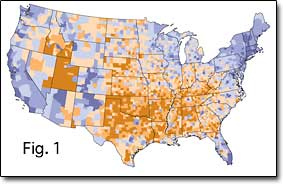
The United States is going through a major demographic transition, according to a U-M analysis showing a geographic divide that reflects a shift toward new patterns of household formation.

The analysis, presented March 30 at the annual meeting of the Population Association of America, shows that this divide is linked to county-level voting patterns.
Sociologists Ron Lesthaeghe and Lisa Neidert from the Institute for Social Research (ISR) say 30 or 40 years ago western European nations moved away from classic family formation patterns of early and universal marriage, fertility within marriage and the use of contraception to stop having children. Instead, these nations increasingly follow patterns that Lesthaeghe has termed the Second Demographic Transition—later ages at marriage, adults living alone or cohabiting, slower rates of remarriage, fertility outside of marriage and the use of contraception to delay or forego childbearing.
Despite a belief that the United States is an exception among developed, democratic nations, with a population that is more religious and socially conservative than that of most European nations, researchers say these same kinds of transitions are in fact occurring in the United States among the white non-Hispanic population.
“The spatial variation of these demographic patterns in the U.S. is very important,” says Lesthaeghe, who, along with Neidert, currently is tracing household formation patterns in the country over time as well as space. “The geography of the second demographic transition unfolds along politico-religious lines.”
A map of this transition shows the spatial distribution of the factors characteristic of the Second Demographic Transition in all 3,131 U.S. counties. The areas with high concentrations of newer, less traditional family patterns tend to be at the edges of the country, on the west and east coasts, while the areas with more traditional family patterns include Utah, southern Idaho, and the south central states.
In another map, Neidert and Lesthaeghe use the same color scheme to show the percentage of the population that voted for George W. Bush in the presidential election of 2004 by county. The results are very similar to that shown in a map of the demographic transition factors.
The researchers also have analyzed these spatial patterns using population cartograms, which scale the area of each county in proportion to its population. One cartogram shows the Second Demographic, while another shows the vote for Bush in the 2004 presidential election.
In the cartograms, the traditional, orange areas of the country are much less prominent than they are in the geographic maps—a fact that has often been overlooked in discussions of the political divide in the United States.
For a copy of the presentation and more information on this and related research, go to sdt.psc.isr.umich.edu.

